Understanding an Unfamiliar Codebase Using Graphify
Exploring a codebase you didn’t write can be overwhelming. There may be dozens of files, imports, APIs, and dependencies to work through.
Figuring out how they all connect can take a lot of time, especially when you’re dealing with a large project.
In this guide, I’ll show you how to use Graphify to explore and understand a codebase in under 10 minutes.
What is Graphify?
Graphify is a tool that maps your project (code, docs, PDFs, images, videos) into a knowledge graph that you can query to understand how different parts of the project are connected.
It is an open-source skill that can be used with AI coding assistants like Claude Code, Cursor, GitHub Copilot, Codex, Gemini CLI, Aider, and 16 others.
Once installed, your code is parsed with tree-sitter AST. This makes the analysis deterministic and allows it to run locally on your computer without an LLM. Your source code is not uploaded to any server.
Exploring a Codebase with Graphify
To see how Graphify works, we’ll use a real project as an example.
The project is an AI-powered news digest that collects industry news from the AI and data space, processes it with AI, stores the results, and sends the latest digest to you by email every morning.
There are several moving parts behind it, including the scraper, database, AI-powered analysis, and email delivery. If you’re seeing the codebase for the first time, understanding how everything connects can take a while.
This is where Graphify can help. Instead of manually jumping between files and tracing dependencies, we can use Graphify to map the project and explore how its different components are connected.
Prerequisites
- An AI coding assistant that supports Graphify. Check the Graphify installation guide to see if your coding assistant is supported.
- The example project cloned locally.
Install Graphify
Run these two command in your terminal to install the Graphify CLI:
uv tool install graphifyy
graphify install
Build the Graph
Open the cloned project in your AI coding assistant and run:
/graphify .This command analyzes the current project and builds a knowledge graph that maps the files, components, and relationships in the codebase.
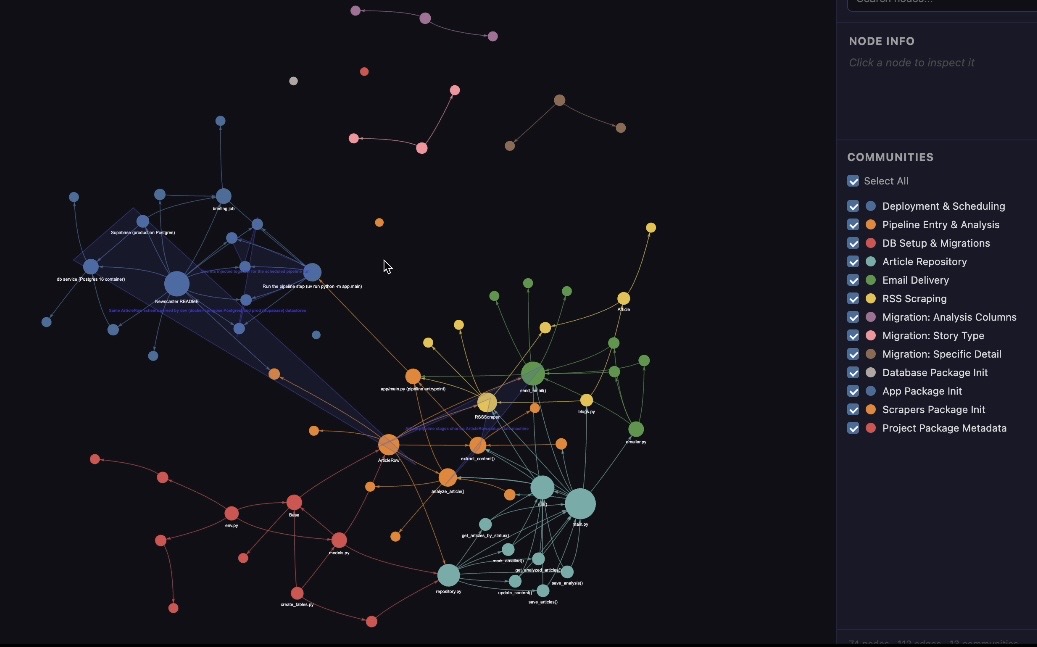
Here’s what the generated graph looks like:
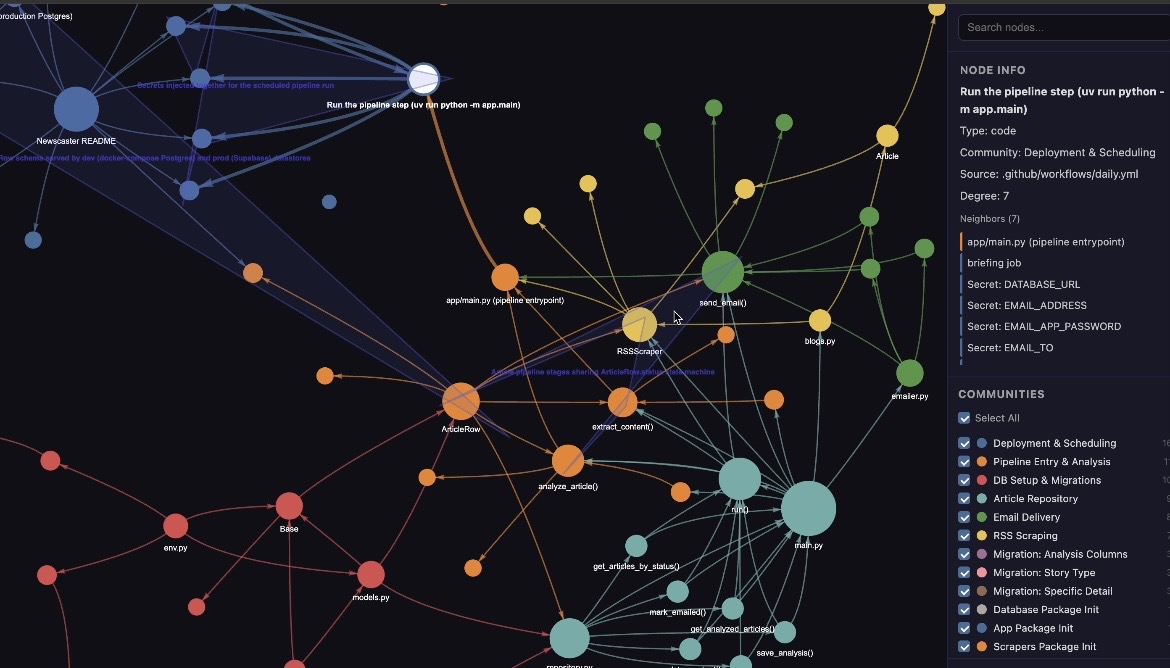
Once the process is complete, Graphify generates a graphify-out/ directory containing the graph and its supporting files.
graphify-out/
├── graph.html
├── GRAPH_REPORT.md
└── graph.jsongraph.html— the interactive visual graph you can open in your browser.GRAPH_REPORT.md— a summary of the important concepts and connections found in the project.graph.json— the complete graph data, which you can query without analyzing the project again.
Query the Graph
Once the graph is built, you can use your AI coding assistant to ask questions about the codebase and investigate how different parts of the project are connected.
Graphify can also surface interesting connections between files, classes, functions, and other components. In this project, for example, it identified the ArticleRow class as a major connection point between different parts of the application.
You can then investigate this connection by asking a question such as:
How does
ArticleRowconnect to the article repository and other parts of the project?
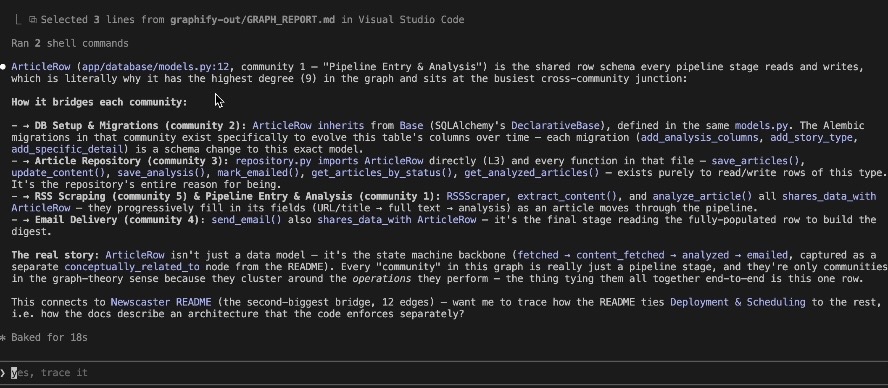
Graphify uses the relationships in the generated graph to help trace these connections and provide context around them.
This gives you a starting point for understanding parts of a codebase that might otherwise be difficult to trace manually.
Final Thoughts
In this guide, we covered how to install Graphify, build a knowledge graph, and query it to explore the relationships inside an unfamiliar codebase.
Hopefully, this gives you a simpler way to approach codebases you didn’t write and helps you spend less time figuring out how everything connects.
If you want to try it out, check out Graphify on GitHub and run it on your own codebase.